Analytics and client reports
What every metric counts, how to filter and export analytics, the agency overview, and read-only report links for clients.
Every number in GraphKit is counted from stored events: nothing is sampled, estimated or modelled. Demo workspaces show their demo data, labelled as demo.
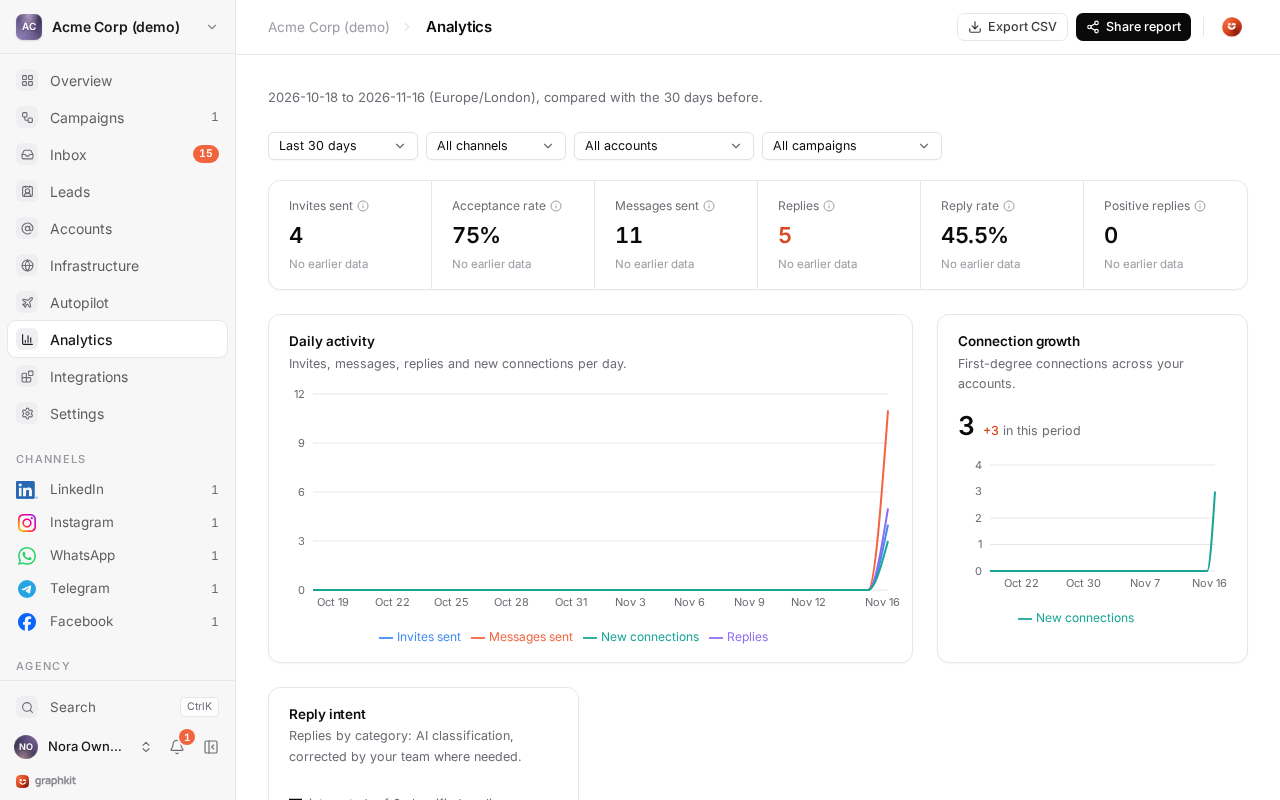
Analytics
Analytics shows the workspace's totals for a date range (the last 30 days by default), the same totals for the previous period of the same length, a chart per day, and breakdowns per channel, account and campaign. Filter by channel, account or campaign. Days follow the workspace time zone.
Each campaign also has its own analytics with per-step results and each account's usage today against its daily limit.
Metric definitions
| Metric | Counts |
|---|---|
| Invites sent | LinkedIn invitations that succeeded. |
| Invites accepted | Of those invitations, the ones whose lead later connected with the same account. Counted on the day the invitation was sent, so it belongs to that day's cohort. |
| Acceptance rate | Invites accepted ÷ invites sent. |
| Messages sent | Campaign messages plus manual messages. |
| Campaign messages | Message and voice-note steps that succeeded. |
| Manual messages | Messages sent by teammates from the inbox or through the API. |
| InMails, profile visits, follows, likes | Steps of that type that succeeded. |
| Contacted | Conversations with an outbound message in the range, counted on the day of the first one. |
| Replies | Conversations whose first inbound message in the range came after an outbound one. A message from someone you never wrote to is not a reply. |
| Reply rate | Replies ÷ contacted. |
| Positive replies | Replies in conversations labelled Interested, Positive, Positive reply, Meeting booked, Meeting, Hot lead or Qualified (any case). |
| Positive rate | Positive replies ÷ replies. |
| Messages received | Inbound messages. |
| New connections | LinkedIn connections made (or first seen) in the range. |
| Failed actions | Steps that ended failed. These feed account health. |
| Email handoffs | Leads handed to a connected email platform. |
| Email replies | First email reply per lead and platform campaign, as reported by the email platform. Kept separate from replies, so nothing is counted twice. |
A rate shows as empty when there is nothing to divide by.
Account health
Accounts that need reconnecting, are restricted or disconnected show as danger. Accounts that are connecting or paused, or where at least 20% of the period's actions failed, show as warning, with the status reason or the latest error.
Export
Export any view to CSV, grouped by day, channel, account or campaign, with a totals row. Names that a spreadsheet could run as formulas are made safe.
Dashboard
The Dashboard shows a getting-started checklist (account connected, leads imported, campaign launched, teammate invited), the last 7 days against the 7 before, recent replies, and alerts for accounts that need attention and webhook endpoints that were disabled.
Agency overview
In an agency organization, Agency overview shows totals across every active client workspace and a table with one row per client, so you can see which clients need attention. It needs an agency role.
Client reports
Share results with a client who has no login. In a workspace, create a report link (admins only). The link opens a read-only page with aggregate metrics only: no messages, no lead names and no account errors.
- The page uses your brand when white-label is on, and the GraphKit brand otherwise.
- The link's token is stored only as a hash and shown once. Revoke a link at any time; it stops working immediately.
The same campaign numbers are available through the API: Get campaign stats.